Simulating Bayesian Updating in R
Normal Likelihood with Normal Prior
Often, it is useful to simulate the Bayesian updating process, to study how the posterior changes with the sample moments of \(x\) . Therefore I have written a R function, which takes a vector of normally distributed data \(x\) , a prior (the hyper-parameters) mean \(\mu\) and variance \(\tau^2\) , and then calculates the posterior.
###############################################################

# Arguments

# data: A vector of data

# mu: a prior mean

# tau2 a prior variance

# plot: FALSE - return a matrix with mean and variance

# TRUE - return a plot of the prior, likelihood and posterior

##############################################################
baysian_updating <- function(data,mu,tau2,plot=FALSE) {
  require("ggplot2")
n=length(data) #lenght of data
xbar = mean(data) # mean of data
sigma2 = sd(data)^2 #variance of data

# likelihood
xx <- seq(xbar-4*sqrt(sigma2),xbar+4*sqrt(sigma2),sqrt(sigma2)/50)
yy <- 1/(sqrt(2*pi*sigma2/n))*exp(-1/(2*sigma2/n)*(xx - xbar)^2 )
df_likelihood <- data.frame(xx,yy,1) # store data
type <- 1
df1 <- data.frame(xx,yy,type)

# prior

xx <- seq(mu -4*sqrt(tau2),mu+4*sqrt(tau2),(sqrt(tau2)/50))
yy = 1/(sqrt(2*pi*tau2))*exp(-1/(2*tau2)*(xx - mu)^2)
type <- 2
df2 <- rbind(df1,data.frame(xx,yy,type))

# Posterior

lambda <- tau2/(tau2 + sigma2/n)
pom = lambda *xbar + (1-lambda)*mu #posterier mean
pov = sigma2/n *tau2/(tau2 + sigma2/n) #posterior variance
xx= seq(pom -4*sqrt(pov),pom+4*sqrt(pov),(sqrt(pov)/50))
yy = 1/(sqrt(2* pi *pov))*exp(-1./(2 *pov)* (xx - pom)^2 )
type <- 3
df3 <- rbind(df2,data.frame(xx,yy,type))
df3$type <- factor(df3$type,levels=c(1,2,3),
                   labels = c("Likelihood", "Prior", "Posterior"))

if(plot==TRUE){
  return(ggplot(data=df3, aes(x=xx, y=yy, group=type, colour=type))
         + ylab("Density")
         + xlab("x")
         + ggtitle("Baysian updating")
         + geom_line()+theme(legend.title=element_blank()))
    } else {
    Nor <- matrix(c(pom,pov), nrow=1, ncol=2, byrow = TRUE)
    return(Nor)
    }
}
Examples
Example 1: Basic usage
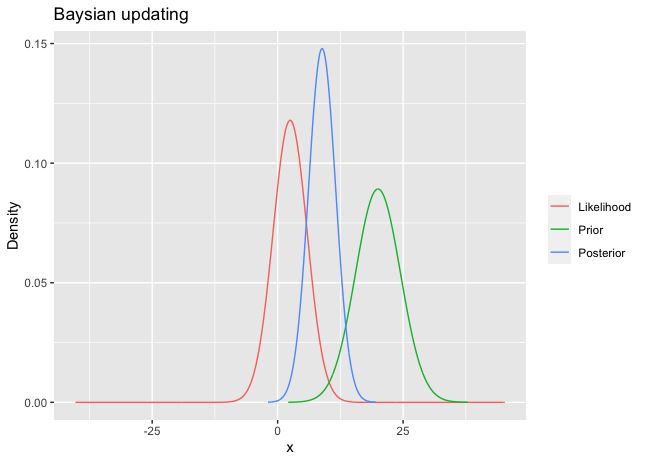
For instance, suppose 10 observations are coming from $N(\theta,100)$ . Assume that the prior on \(\theta\) is \(N(20,20)\) . Using the numerical example in the R code below, the posterior is \(N(1.322028, 1.086328)\). These three densities are shown in Figure 1.
# Example 1

dat <- 10*rnorm(10) # generate normal data
df <- baysian_updating(dat,20,20,plot=TRUE)
df
Example 2: Sample Size Simulation
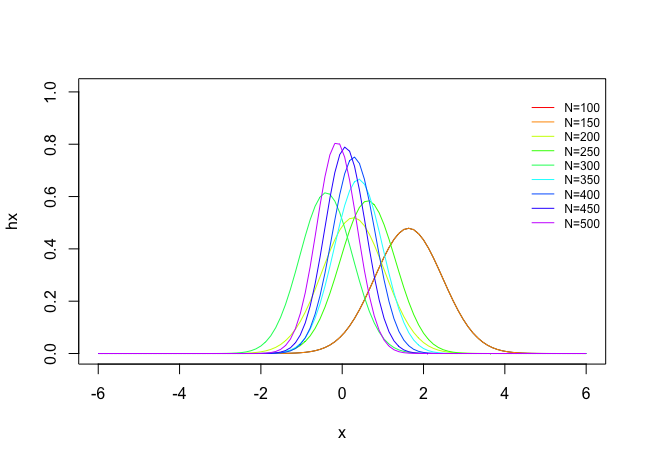
You can also easily make a sample size Monte Carlo simulation

## Example 2

set.seed(1)
j<-0
colors <- rainbow(10)
labels=c()
for(i in seq(100,500,50)){
  j<-j+1
  dat <- 10*rnorm(i) # generate normal data
  df<- baysian_updating(dat,5,5)
  df <- cbind(df,i)
  if(j==1){
    all <- df
  }
  labels <- c(labels,paste("N", i, sep = "=") )
  all <- rbind(all,df)
  x <- seq(-6, 6, length=100)
  hx <- dnorm(x,mean=all[j,1],sd=sqrt(all[j,2]))
  if(j==1){
    plot(x, hx, type="l", lty=1,xlim=c(-6,6),ylim=c(0,1.01))
  } else {
    lines(x, hx, type="l", lty=1,col=colors[j])
  }
}

legend("topright", labels,title="",lty=1,col=colors,bty='n', cex=.75)
Example 3: Recursive Bayesian Updating
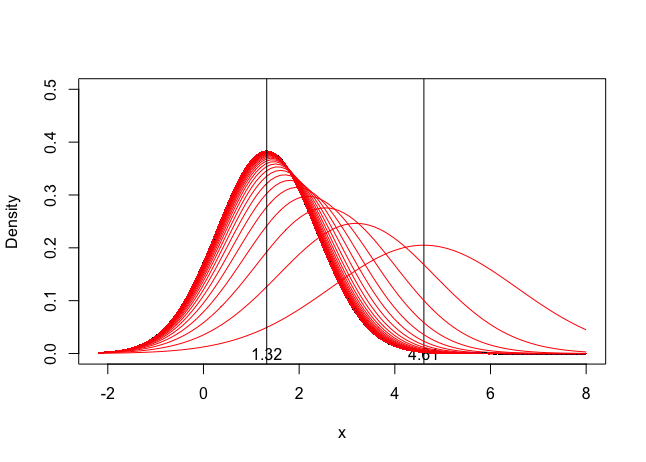
Simulate the updating process for recursive Bayesian updating
# Example 3

set.seed(1)
sims <- 1000 # number of simulations
j<-0
colors <- rainbow(sims) #generate colors
pom <- 10 # prior mean
pov <- 10 # prior variance
df <-  matrix(c(pom,pov), nrow=1, ncol=2, byrow = TRUE)
dat <- 10*rnorm(10) # generate normal data

for(i in seq(1,sims,1)){
  j<-j+1
  if(j==1){
  df<- baysian_updating(dat,pom,pov)
  } else {
  df<- baysian_updating(dat,df[1,1],df[1,1])
  }
  x <- seq(-2.2, 8, length=100)
  hx <- dnorm(x,mean=df[1,1],sd=sqrt(df[1,2]))
  if(j==1){
    plot(x, hx, type="l", lty=1,col=colors[j],xlim=c(-2.2,8),ylim=c(0,0.5),xlab="x",ylab="Density")
    abline(v=df[1,1])
    text(df[1,1], 0 , round(df[1,1], 2))
  } else {
    lines(x, hx, type="l", lty=1,col=colors[j])
  }
}

abline(v=df[1,1])
text(df[1,1], 0 , round(df[1,1], 2))

Comments